
Panama City Beach weather and the best time to visit
Panama City Beach weather is most useful as a planning question: do you want warmer daytime conditions, an island visit or a particular evening boat departure? Historical air-temperature and rainfall averages help compare months. For swimming on your dates, use current water conditions and local warnings. Start with the activities that matter, then leave room to adapt the order of your days.
May has the lowest monthly rainfall normal in the regional station series used here. July and August have the highest average daily maximum temperatures. Those patterns support a comparison, not a promise of dry days or comfortable water. The beach flag system remains relevant in every season, including when the surface looks calm.
Monthly climate at Panama City 5N
The table uses NOAA/NCEI's Panama City 5N station and the historical normal period from 1991 to 2020, in a report generated on 13 February 2026. This is a regional comparison station, not a sensor on Panama City Beach's sand and not the airport weather station. Max and min mean average daily high and low air temperatures. They are not record extremes.
| Month | Average high °C | Average low °C | Monthly rainfall mm |
|---|---|---|---|
| January | 18.0 | 5.9 | 121.7 |
| February | 19.7 | 7.8 | 125.7 |
| March | 22.7 | 10.8 | 127.8 |
| April | 25.9 | 14.3 | 103.9 |
| May | 29.6 | 18.7 | 84.1 |
| June | 31.8 | 22.7 | 147.8 |
| July | 32.8 | 23.9 | 188.2 |
| August | 32.7 | 23.7 | 189.0 |
| September | 31.7 | 21.7 | 177.3 |
| October | 27.9 | 16.2 | 87.6 |
| November | 22.9 | 10.1 | 94.0 |
| December | 19.2 | 7.3 | 109.2 |
Rainfall figures are normal monthly totals, not the number of rainy days. Use them to understand the historical pattern, then consult a current forecast closer to departure. The air-temperature series does not supply water temperatures, sunshine hours or underwater visibility. Keep those questions separate when deciding between a shore visit and a water activity.
Our pick: an evening sail
This evening sail is a planning example; check seasonal availability and weather before booking.
Hand-picked tours, booked through Viator. Prices are indicative starting prices in US dollars (as of November 2026). Tap a tour for live availability and the current price in your currency.
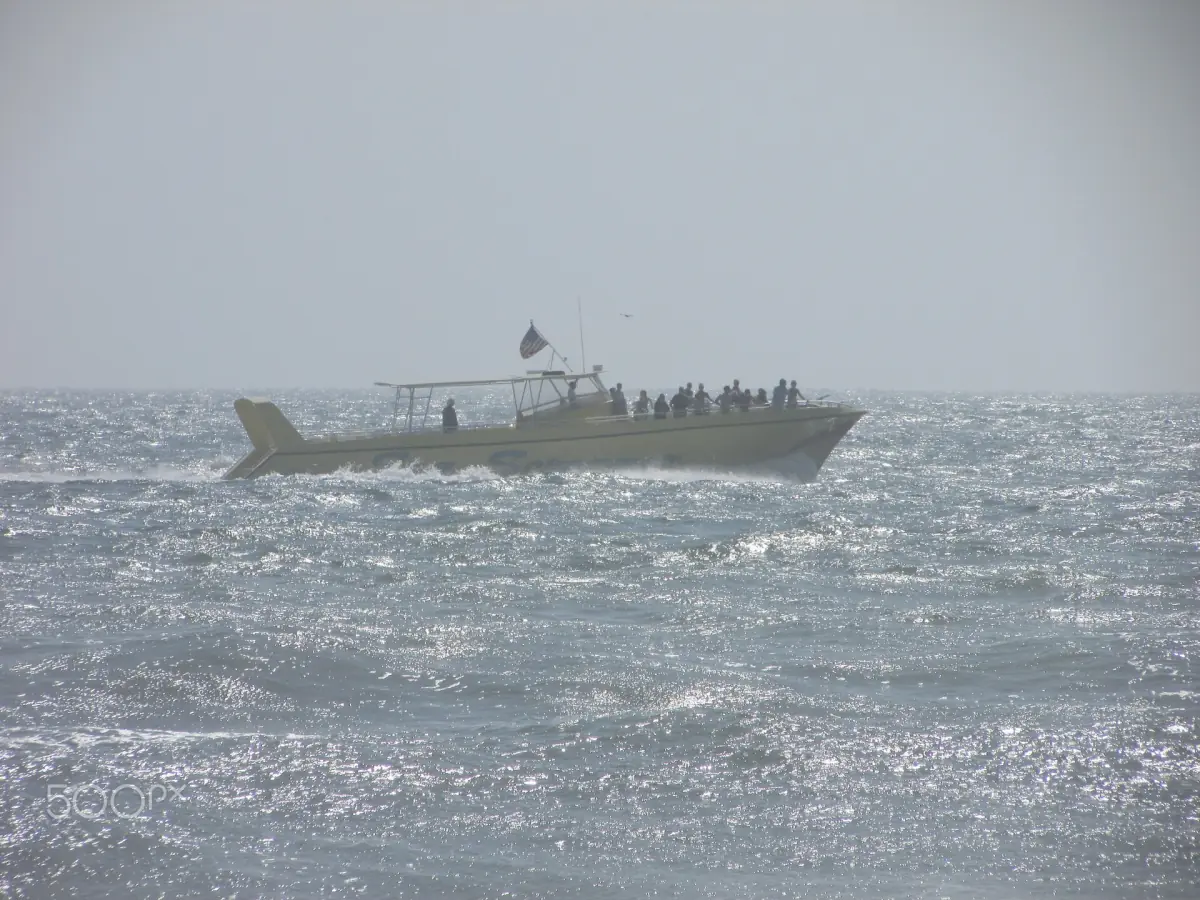
A weather-dependent evening on the water
This two-hour sunset sail includes one onboard beverage, with live music on selected evenings. Use it as a seasonal planning example; departure and sunset views depend on conditions.
Hurricane season from 1 June to 30 November
The Atlantic, Caribbean and Gulf hurricane season runs from 1 June to 30 November. Tropical systems can bring storm surge, heavy rain, wind, high surf and rip currents. A system farther away can still produce dangerous waves at the coast, so the distance to the storm centre is not a useful reason to ignore a local warning.
Keep current weather information alongside your accommodation and transport plans. Follow official instructions for the place you are visiting, and retain flexibility around water-based bookings. Travelling outside hurricane season does not establish safe swimming conditions either: rip currents can occur on apparently calm days. A monthly average and a water-entry decision answer different questions.
Spring, summer, autumn and winter
Spring brings rising average daytime temperatures in this series. The city's spring-break planning material describes increased visitor pressure from early March into early April. Treat that as a timing consideration when choosing dates, rather than assuming a particular event programme or applying an old seasonal rule to a later year.
Summer has the highest average daily highs and higher rainfall normals than May. Autumn moves from September's warmer values towards cooler November nights. Winter has lower air-temperature averages, so decide whether your priority is time ashore or a particular boat activity. For Shell Island, use the operating schedule for the chosen ferry and date; winter crossings should be arranged individually rather than presumed from a summer timetable.
Wind, thunderstorms and seasonal boat outings
Build a boat day around current weather and water advice, not the climate table. The evening sail listed here lasts two hours, includes one beverage and has live music on selected evenings. It departs behind the Bayside property, with advance check-in and a walk to the dock. Plan that ground journey separately using the arrival and local transport information. Its departure remains dependent on season and conditions; neither sunset views nor dolphin sightings are promised.
Compare boat formats before choosing a time slot. Regional water-quality or red-tide notices also need the correct location and date: a notice for another shore does not describe the whole Panama City Beach coastline. Consult the current city and health-department information for your destination, without reading the absence of a notice here as an all-clear.
Weather planning questions
Is May guaranteed to be dry?
May has the lowest monthly rainfall normal in this station series. That historical comparison does not predict the weather during an individual visit.
Are these sea temperatures?
No. The high and low values describe average daily air temperatures at Panama City 5N. They should not be used as a water-temperature table.
Can I assume a winter ferry will run?
Use the schedule for your selected departure and date. Seasonal ferry arrangements differ, so a summer schedule is not a winter travel plan.